About me

Greetings! I'm Lex, a Data Analyst with a foundation in Front-End Web Development. My journey has been fueled by a fervent dedication to harnessing data to inform strategic business decisions. With a proven track record in Python, SQL, and Tableau, I specialize in analyzing data, crafting insightful visualizations, and building interactive dashboards.

I take pride in my ability to deliver concrete results. For instance, in a recent project focused on optimizing funnel performance, I employed SQL, Python, and Tableau to dissect and visualize data. This endeavor culminated in the formulation of targeted marketing strategies tailored to specific age demographics, resulting in notable enhancements in user acquisition, ride completion rates, and a remarkable 15% increase in quarterly revenue.

Driven by a relentless pursuit of knowledge and innovation, I actively stay abreast of the latest developments in data science. Whether it's tackling personal projects or immersing myself in industry events, I am always eager to broaden my horizons and deepen my expertise.

I'm thrilled at the prospect of collaborating with like-minded individuals to propel success in the dynamic realm of data analytics. Let's connect and embark on this exciting journey together, shaping a brighter future for your organization.

Feel free to reach out to me via the provided contact form or drop me an email at lexromo1003@gmail.com
Projects

NYC-SHORT-TERM RENTAL

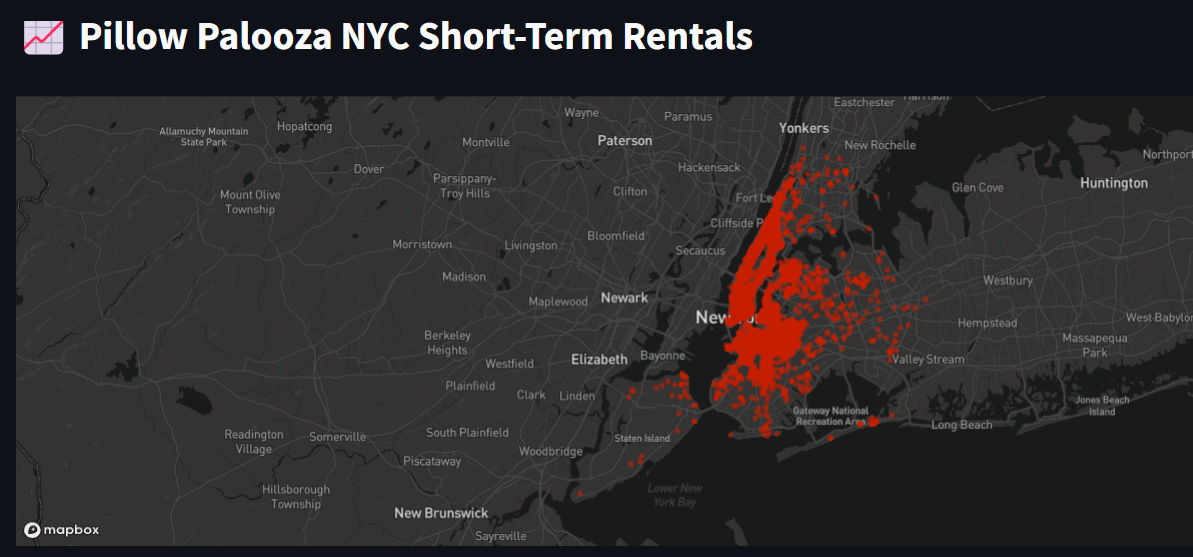
Pillow Palooza, a start-up disrupting the real estate market, seeks to optimize its short-term rental strategy in New York City. With a surge in demand for short-term rentals, the company aims to leverage data insights to maximize revenue and occupancy rates. By collecting and analyzing Airbnb listing data, the project aims to uncover trends in popular neighborhoods, rental prices, property types, length of stay, and demand over time. These insights will empower Pillow Palooza to make informed decisions and potentially drive growth and success in the competitive NYC rental market.

Learn more

PRODUCT A/B TESTING

This project is focused on GloBox, an e-commerce enterprise recognized for its boutique fashion items and premium decor products. Nevertheless, the company has witnessed substantial growth in its food and beverage offerings over recent months. To capitalize on this expansion and amplify revenue, the company seeks to raise awareness of this product category. Consequently, an A/B test has been proposed to spotlight food and beverage products through a banner. The primary objective of this test is to gauge its influence on user behavior, with a specific emphasis on purchases and conversions.

Learn more

JOB SURVEY PRESENTATION

The Job Survey - Presentation delves into the dynamic realm of technology, aiming to provide actionable insights for businesses and professionals. Through a comprehensive survey, the initiative seeks to identify prevalent programming languages and database technologies while understanding the reasons behind their popularity. By focusing on the deeper dynamics shaping the tech industry today and forecasting future trends, the presentation extends beyond surface observations to offer strategic pathways for success in the ever-evolving tech ecosystem.

Learn more

LOANS EDA

The purpose of this presentation is to conduct Data Exploratory Analysis, offering visual representations of the relationships between Occupation, Loan Amount, Borrower APR, Prosper Score, Accounts Created over time, and Prosper Alpha Ratings. Delving into the Prosper loan dataset comprising 113,937 loans with 81 variables each, including loan amount, borrower rate, current loan status, borrower income, and more, the initiative aims to provide a thorough overview of the dataset. Through exploratory data analysis techniques, the presentation seeks to uncover insights and patterns within the data, aiding in understanding and interpretation for analytical and decision-making purposes.

Learn more

FLIGHT ANALYSIS (TABLEAU)

The Flight Analysis project utilizes data from the USA Flights for the Year 2015 to delve into various aspects of flight patterns and trends. Through interactive visualizations, the project explores key metrics such as flight delays, cancellations, on-time performance, and route popularity. By leveraging Tableau's powerful analytics capabilities, the project aims to provide insights into factors influencing flight operations, airline performance, and passenger experiences during the specified period. This analysis offers stakeholders valuable insights to optimize operations, improve customer satisfaction, and enhance overall efficiency within the aviation industry.

Learn more